Python 性能分析工具 cProfile
一般看看 py 脚本的性能, 可以使用古老的 linux 工具 time, 或者自己在代码中写上 time.clock().
➜  codewars  time python3 xingneng.py
python3 xingneng.py  4.64s user 0.02s system 99% cpu 4.698 total
这样粒度比较粗超, 进一步的分析可以借助标准库中的三个分析模块: cProfile profile hotshot.
在python3中, hotshot已经被废弃了, 如果没有特殊需求, 建议使用 cProfile. 本文简单介绍下使用 gprof2dot 和 cProfile 分析 python 脚本性能.
1. cProfile 和 profile
cProfile 和 profile 的用法基本相同, 一个是 C 实现的模块, 一个是 Python 实现的模块.
推荐使用 cProfile, 因为profile 分析很慢, 开销很多~
具体用法有代码中使用以及命令行使用, 如下:
代码中使用
import cProfile

cProfile.run('test()')


import profile

profile.run('test()')
Terminal 中使用
测试代码如下, 跑斐波那契数列:
fib = lambda n: 1 if n <= 2 else fib(n - 1) + fib(n - 2)


def test1():
    fib(20)


def test2():
    fib(30)


def test3():
    fib(35)


if __name__ == '__main__':
    test1()
    test2()
    test3()
使用方式如下:
➜  codewars  python3 -m cProfile xingneng.py
         20132541 function calls (7 primitive calls) in 5.947 seconds

   Ordered by: standard name

   ncalls  tottime  percall  cumtime  percall filename:lineno(function)
20132537/3    5.947    0.000    5.947    1.982 xingneng.py:1(<lambda>)
        1    0.000    0.000    5.947    5.947 xingneng.py:1(<module>)
        1    0.000    0.000    5.947    5.947 xingneng.py:4(test)
        1    0.000    0.000    5.947    5.947 {built-in method builtins.exec}
        1    0.000    0.000    0.000    0.000 {method 'disable' of '_lsprof.Profiler' objects}
➜  codewars  python3 -m profile xingneng.py


         20132544 function calls (10 primitive calls) in 46.235 seconds

   Ordered by: standard name

   ncalls  tottime  percall  cumtime  percall filename:lineno(function)
        1    0.000    0.000   46.234   46.234 :0(exec)
        1    0.001    0.001    0.001    0.001 :0(setprofile)
        1    0.000    0.000   46.235   46.235 profile:0(<code object <module> at 0x106e87810, file "xingneng.py", line 1>)
        0    0.000             0.000          profile:0(profiler)
20132537/3   46.234    0.000   46.234   15.411 xingneng.py:1(<lambda>)
        1    0.000    0.000   46.234   46.234 xingneng.py:1(<module>)
        1    0.000    0.000   42.455   42.455 xingneng.py:12(test3)
        1    0.000    0.000    0.033    0.033 xingneng.py:4(test1)
        1    0.000    0.000    3.746    3.746 xingneng.py:8(test2)
可以看到每个函数的具体消耗时间. 此处有个问题, 为毛使用 profile 会这么慢?
2. 图形化展示
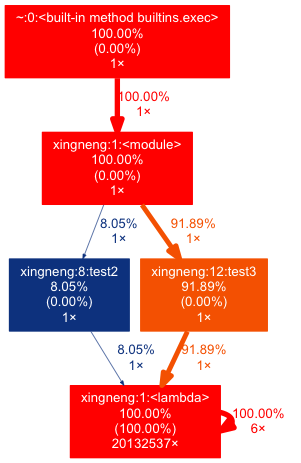
调优自己的代码可以在 log 中打印分析结果, 不过还是图像比较直观, 可以借助 gprof2dot, 可以看到调用次数, 占用时间和百分比, 简直6到家了~
2.1 安装
- Mac
brew install gprof2dot
- Debian/Ubuntu users
apt-get install python graphviz
2.2 使用
比如我将 cProfile 执行后的性能分析文件, 渲染成图片:
➜  codewars  python3 -m cProfile -o output.pstat xingneng.py
➜  codewars  gprof2dot -f pstats output.pstat | dot -Tpng -o output.png
结果如下:
其他好玩的绘图用法请看文档
参考文档
blog comments powered by Disqus
Published
08 March 2016